Monthly Archives: January 2016
Looking Back and Ahead
Weather and Climate: Looking Back and Ahead
By Bruce Rottink, Volunteer Nature Guide and Retired Research Forester
Talk about a double whammy! The Portland area, including Tryon Creek State Natural Area (TCSNA), has set an all-time record for December rainfall, and the 2015 United Nations Climate Change Conference has just wrapped up in Paris! Lots of people are thinking about the weather and climate now!
The growth, survival and distribution of the plants at Tryon Creek State Natural Area (TCSNA) are affected by a host of factors. These factors include climate and weather, but also things like soil chemistry, soil depth, the steepness of the slope the plant is growing on, and soil moisture holding capacity. Probably the two most important weather variables are temperature and rain fall. Most of the discussion around climate change has to do with increases in the mean annual temperatures. This is a good place to start, but perhaps inadequate to explain all the changes we might see.
So how might climate change effect our forest?
Climate change might affect TCSNA in many ways, for example, altering the species composition of the forest. I am in my third year of monitoring the growth and development of a variety of plants in my phenology study at TCSNA. In my monitoring I visit the same plants every week to ten days and record their status. Perhaps looking at some of the results might provide a peek into the future. One of the species that I am monitoring is Pacific waterleaf (Hydrophyllum tenuipes). As the waterleaf tends to form dense clumps, I am monitoring approximately a 3-foot diameter circle of plants at each of four separate areas, rather than just trying to track a single stalk.
Pacific waterleaf is a perennial plant, which sends new shoots up every year from rhizomes. Think of rhizomes as “underground stems”. The above ground shoots die back in the “off season” and only the roots and rhizomes persist from year to year. At TCSNA waterleaf is generally from 40 to 60 cm (16 – 24”) tall at maturity. These shoots die back sometime in the summer, generally after they have produced a crop of seeds.

Pacific waterleaf near Red Fox Trail
Reviewing the phenological records, the last two years have seen a lot of variability in the behavior of the Pacific waterleaf at TCSNA. The chart below indicates the presence or absence of waterleaf leaves at each of the four monitoring sites on a weekly basis.
Weekly Presence/Absence of Pacific Waterleaf at Four Locations at TCSNA over Two Years
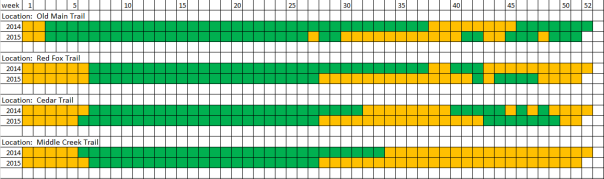
Key: Yellow = Waterleaf Absent; Green = Waterleaf Present;
Week 1 = first week in January, Week 26 = end of June, Week 52 = last week of December
The late-winter through early-summer growth is the time when the waterleaf is making the vast majority of its sugar to support the plant, AND when the plant is producing seeds. The second emergence of leaves is around weeks 40 to 45 (roughly October thru early November). This “second leafing out” produces leaves that tend to be fairly small and I’ve never seen this second leafing produce flowers, much less seeds. And, as you notice, there is a certain amount of “now you see it, now you don’t” with this second leafing out. In at least some cases, the second leafing out leaves are eliminated by a serious frost.
It is interesting to note that on the Middle Creek Trail, there is never a “second leafing out.” The major difference between the Middle Creek waterleaf patch, and all the others is that the Middle Creek patch is on a significant slope, and is more exposed to direct sunlight. All the other patches are on flatter sites. Thus, it may dry out sooner than the other patches, and not have the late-season water it needs for a second set of leaves.
Why are these years so different?
- One thing that you can see immediately is that the green bar (indicating the presence of waterleaf plants) consistently ends earlier in 2015 than in 2014 for any given site. In 2015 the leaves disappeared on average 7 weeks earlier than in in 2014. This is a significant amount of time.
- The seeds of the waterleaf mature approximately in mid-June, so in both cases the plants survived long enough to produce seeds, and nothing more. It is likely that the leaves which persist after seed production are producing sugars to help support the plant for the next growing season.
What could have caused that difference?
The contrasts in weather between 2014 and 2015 are dramatic. I think the weather data probably goes a long way in explaining this year-to-year behavioral difference.
First let’s look at the (Portland) air temperatures maximum and minimum for the years. In each chart, the highest average minimum or maximum air temperature is highlighted in color. Where the temperature for any month was more than 5° F higher than any other year, it is highlighted in red.
Average Daily Minimum Air Temperature – Portland
(In °F; higher year highlighted red)
| Month | 2014 | 2015 |
| January | 35.1 | 37 |
| February | 34.6 | 41.5 |
| March | 40.2 | 42 |
| April | 44.7 | 42.6 |
| May | 51.3 | 51.5 |
| June | 53.9 | 57.9 |
| July | 59.8 | 61.1 |
| August | 61.4 | 60.5 |
| September | 56.5 | 53.1 |
| October | 52.1 | 51.2 |
| November | 40.7 | 38.5 |
| December | 39.1 |
You can easily see that for most of the spring and early summer months, the minimum temperatures were higher in 2015 than in 2014. But that’s just the start. The next chart tells us even more.
Average Daily Maximum Air Temperature – Portland
(In °F; higher year highlighted in red)
| Month | 2014 | 2015 |
| January | 47.7 | 49.9 |
| February | 46 | 56.8 |
| March | 58 | 62.8 |
| April | 62.6 | 62.9 |
| May | 71.1 | 70.7 |
| June | 73.4 | 82.7 |
| July | 83.8 | 86.7 |
| August | 84.8 | 84.3 |
| September | 78.7 | 75.8 |
| October | 68 | 69 |
| November | 51.9 | 52 |
| December | 49.2 |
Again, for most of the spring and early summer months, the average maximum daily temperature was higher to dramatically higher in 2015 than in 2014. The yellow-highlighted months are more than 5°F warmer than the comparable month in 2014. The average high temperature in June 2015 was almost 10° F higher than June 2014! This higher temperature would probably cause the plants to lose more water, produce less sugar, and grow less in 2015 than they did in 2014. But the icing on the cake is yet to come. Just take a look at spring/summer rainfall data (from the PCC Sylvania rain gauge station).
February through June Rainfall
(Inches)
| Year | Amount |
| 2014 | 22.76 |
| 2015 | 13.42 |
Wow! The early growing season rainfall in 2014 was nearly twice what it was in the comparable time in 2015.
The “growing season” for Pacific Waterleaf in 2015 was both hotter and drier than it was in 2014. The result was that the above ground waterleaf shoots disappeared on average 7 weeks earlier. Yikes! A seven-week difference in leaf persistence is not trivial.
The future!
I can’t wait to see what kind of impact this has on waterleaf in the 2016 season.
Think of all the linkages that there may be between waterleaf and the other organisms in the forest. Possibly less food for waterleaf-eating insects, less cover for mice scurrying around looking for food, fewer waterleaf seeds for food, and possibly increased soil erosion from late summer rainstorms.
This is the story of just one species of plant, but it might foretell the challenges we face if climate change continues unabated.

